By Lawrence Belanger
Local Journalism Initiative
Our homes are sometimes troves of history, telling us the stories of our heritage, our injustices, and even the weather. David Winch, a retired writer for the UN’s Editorial Service and now a freelance writer based in the Townships found one such “weather diary” when he moved into his house in North Hatley in 2018. When he found the records, “what struck me [was] that the melts were around the same dates each year.” Winch previously sent a letter to the editor on the subject shortly after he moved into the house in question, saying he felt “reassured” by the consistency of the dates.
With a somewhat milder winter this year, without a major snowstorm until January, The Record spoke with Winch on the phone to talk about weather diaries and what they say about changes in the seasons from year to year.
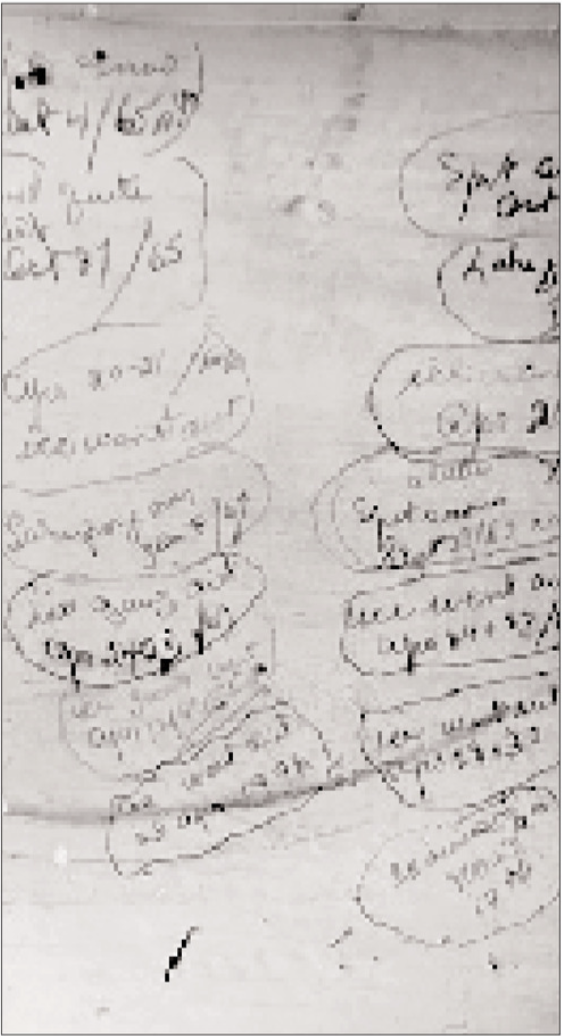
Winch explained that local citizen Mabel Kezar noted the dates that “the ice went out” in the 1960s and 1990s, which were scrawled on the back wall of a closet in his 1938 home with a pencil. Thaw dates were included for each year from 1961 to 1966, with a gap in 1964, and then again for 1995 and 1996. In all eight examples, the ice melted on Lake Massawippi within the same few weeks at the end of April or the start of May. Winch hasn’t picked up a pencil to add to the logs in the closet, which was renovated and painted over.
“We should have continued that,” regrets Winch, although he thinks that the ice melted on 22 April last year.
The Record also reached out to environment and climate experts to better understand what, if any, value these sorts of logs might have for their research, and what sort of conclusions one might safely draw from these.
Alexander Langlois, a professor at the Faculté des lettres et sciences humaines of the Université de Sherbrooke, laments that records of this type don’t exist for remote regions in the Arctic. “If we could have that information or records of that in the Arctic, that would be useful,” for his field of work, which involves travelling to the Arctic and seeks in part to quantify the extent to which human activity is responsible for the warming in the Arctic.
The records that the area’s residents like Winch have found paint a picture of how a local environment works, its trends over time, and how they compare to other locations around the world. For example, “some glaciers melt pretty much every year,” explained Langlois, but other glaciers, lakes, and rivers have roughly the same dates of freezing and melting.
“To have that information in a local area…it helps you understand what happens [there],” said Langlois. Winch also supports getting more data about the weather, such as melts, freezes, and snow accumulations.
“A diary from North Hatley 100 years ago would mean a lot to me,” says Winch, who also emphasizes that he is “not trying to make any wider prediction about climate or weather,” instead saying that he is “just noting what I see with my own eyes in this ‘micro-region’.”
Matthew Peros, Co-Chair of the Department of Environment, Agriculture, and Geography at Bishop’s University, says that to get a better idea of how the seasons have changed over a longer period, one needs a bigger perspective. He cautions against looking at any one specific site’s record and coming to any broad conclusions.
“I think that it’s important to know that any one site can react differently based on a lot of local factors. It doesn’t necessarily record general trends,” explains Peros.
Nevertheless, Peros appreciates that people “are looking at these questions themselves and trying to make an opinion on it,” calling it “very positive.” Peros’ work brings him back further, going beyond the human scale to look at the geological evidence of tree rings, which indicate weather such as rainfall and temperature based on the width of a ring, sometimes over hundreds of years.
Peros says that we can use the kinds of domestic records in Winch’s home, which include diaries, almanacs, and even old newspapers, to fill out and add to data from instrumental stations and satellites. “Instrumental stations are sporadic,” explains Peros, who adds that they don’t go further back than the 1900s. In the case of satellites, scientists only have environmental data going back a few decades.
Langlois echoes this when he explains how Arctic data on snowfall, ice, and temperature is difficult to get. “Spatially and temporally. It’s very hard to keep measurements going,” because of how funding and projects work, it’s like starting anew every few years. This is part of the reason why estimates about the ice caps melting have been revised over the last 15 or so years.